Schedule and Monitor Pipeline Tests – Monitoring Azure Data Storage and Processing
Azure Monitoring Overview, Exams of Microsoft, Microsoft DP-203, Tune Queries by Using CacheIn Chapter 6 you learned about the different types of schedules available for triggering a pipeline: scheduled, tumbling window, storage events, and custom events. When scheduling a pipeline trigger, you select a frequency, such as daily, weekly, hourly, or twice per hour. Nearly any combination is supported. A tumbling window trigger manages dependent triggers so that they are not triggered until the upstream dependencies have completed. A storage event triggers a pipeline when a file is added to a folder in an ADLS container, for example. Finally, a custom event trigger can be bound to an Event Grid subscription that exposes the invocation to many endpoints, for example, Event Hubs. Monitoring the execution of a pipeline is the primary purpose of this chapter. From a testing perspective, most of the content for this topic is in Chapter 10.
You should not test changes to a pipeline in a production/live environment; rather, you should set up a replica environment that is identical to the live environment and test any changes to your logic against this environment. This will prevent any corruption or deletion of your production data. From a pipeline artifact perspective, you learned about implementing version control in Chapter 6. Each time you click the Commit button, the changes are uploaded to GitHub. You also learned about Azure DevOps, CI/CD, and TDD, which are useful products and techniques for managing code development and testing changes from your development environments by testing and then deploying them into the live production environment.
Interpret a Spark Directed Acyclic Graph
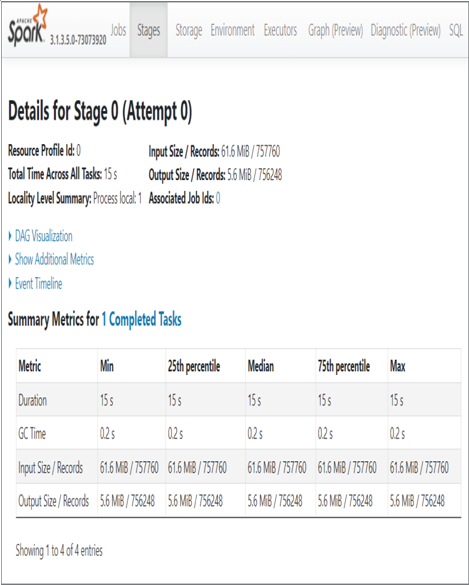
Chapter 1 introduced directed acyclic graphs (DAG) in the context of Azure Data Lake Analytics, which you know now will deprecate. In this context the DAG is associated with an Apache Spark application (refer to Figure 9.16). When you select a job, some details about it are displayed, such as duration, the number of rows processed, and the amount of data read and written in megabytes. There is also a link named View Details, which opens a page similar to Figure 9.25.

FIGURE 9.25 Apache Spark application details
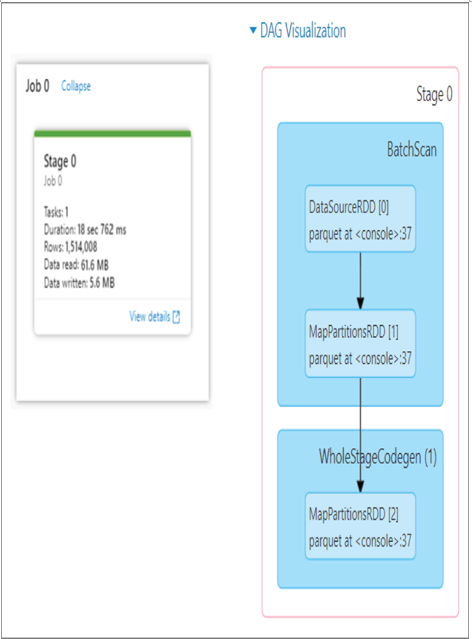
The default tab, Stages, contains an expandable grouping named DAG Visualization. Expanding this group results in a DAG diagram representing the different steps the application took as it progressed from invocation to completion. The job in this example is not complex, as shown in Figure 9.26. However, some applications can be very complex and have tens or hundreds of steps that are performed within the job. Consider this as being like a SQL execution plan, but for an Apache Spark application job.

FIGURE 9.26 DAG Visualization
A graphical visualization of how a Scala notebook is running on an Azure Synapse Analytics Apache Spark pool at such a low level provides many benefits. When a job is not performing as expected, you can get some idea where the latency is coming from. The same goes for exceptions and errors. When a job exits prematurely or unexpectedly and the error message is not helpful, this illustration will provide some ideas about where to begin your analysis and troubleshooting activities.
Monitor Stream Processing
This content was covered in the “Configure Monitoring Services” section—specifically, in the “Azure Synapse Analytics” subsection.
Implement a Pipeline Alert Strategy
In Exercise 9.2, you created an alert rule for monitoring pipeline runs. The rule and some of the metrics are shown in Figure 9.4 and Figure 9.5.
