Azure SQL – Monitoring Azure Data Storage and Processing
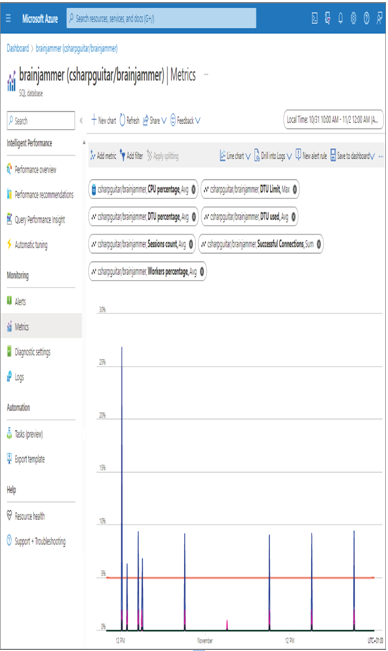
Develop a Batch Processing Solution, Exams of Microsoft, Handle Skew in Data, Microsoft DP-203, Tune Queries by Using CacheThe metrics available for an Azure SQL database are very similar to what you saw previously regarding a dedicated SQL pool. As shown in Figure 9.34, metrics include CPU Percentage, DTU Limit, DTU Percentage, DTU Used, Sessions Count, Successful Connections, and Workers Percentage, all of which are useful for gaining an overview of the resource health.

FIGURE 9.34 The Azure SQL Metrics blade
The Diagnostics Settings blade includes the following categories:
- SQL Insights
- Automatic Tuning
- Query Store Runtime Statistics
- Query Store Wait Statistics
- Errors
- Database Wait Statistics
- Timeouts
- Blocks
- Deadlocks
- Basic
- InstanceAndAppAdvanced
- WorkloadManagement
Each category, when configured to be stored into a Log Analytics workspace, represents a table with multiple columns. The columns typically contain performance and status information such as operation duration or error messages. In all cases, you should enable Diagnostic Settings for all your products and target their storage to an Azure Monitor Log Analytics workspace. This will give you a great platform to gain insights into the overall health of your data analytics solution.
Summary
This chapter focused on the monitoring capabilities provided by the Azure products most commonly used for data analytics, which includes Azure storage accounts, including an ADLS container, Azure Synapse Analytics, Azure Stream Analytics, and Azure Databricks. Each of these products includes Azure Monitor components such as alerts, metrics, diagnostic settings, and logs by default. Those components are available in the Azure portal; however, they are not enabled by default. You learned how to enable them and configure them and, in many cases, gained some insights into what the metrics mean and how to interpret and apply their values.
Capturing logs is the most common approach for gathering insights into how a system is performing. Each pipeline execution, for example, logs an entry into the pipeline runs table on the Monitor hub in Azure Synapse Analytics. This log includes a duration value, which is the amount of time the pipeline took to complete. If that number seems too large, you can drill down into the different activities to see which is taking the most time. Then you can drill down further into that specific activity until you find exactly where the latency is happening, and resolve it. If latency is coming from database queries, you learned about DMV, which can break the query into steps, while both SHOW_STATISTICS and an execution plan can illustrate the query execution process in a graphic. Finally, you learned about directed acyclic graphs (DAGs), which are similar to an execution plan but target the steps taken while running a notebook on an Apache Spark cluster.
